
Online consumers abandoning their shopping carts before making a purchase is one of the greatest challenges that most ecommerce brands face. According to the Baymard Institute, the average shopping cart abandonment rate across online retailers is 69.89%. However, this can vary across sites and brands. It’s important to track your own site’s shopping cart abandonment rate so that you can monitor trends and address any issues in your checkout process.
How to Set Up a Shopping Cart Funnel in Google Analytics
Before you can view your shopping cart abandonment rates in Google Analytics, you need to set up a shopping cart funnel. We’ll walk you through the steps of doing this for a conversion process with multiple steps.
After you sign into your Google Analytics account, click on Admin in the upper right-hand corner and choose which profile you’d like to set up the funnel for. Then, click on Goals. To add a new goal, click on the red + New Goal button. You can then create a custom template.
You’ll need to give the goal a name and choose Destination as the type of goal.
Set Up a Shopping Cart Funnel in Google Analytics” width=”722″ style=”width: 722px;”>
You’ll then be prompted to enter the URL of the last page in your funnel in the Destination Equals to field. This URL should be for the page where you want your customers to end up.
Now, make sure that you turn on the Funnel option. You will need to run through the checkout process as a potential customer would so that you can note each step in the process. Be sure to include each step in the funnel that leads up to the confirmation page.

Once you save the goal, Google Analytics will start to collect data for this funnel over the next day.
How to Track Shopping Cart Abandonment in Google Analytics
Once you set up a shopping cart funnel, you can track your shopping cart abandonment rates. Log into your Google Analytics account, then click on Conversions > Ecommerce > Shopping Analysis > Shopping Behavior.

Then, you will see a report for the different stages of your customer’s journey on your site for the specific time period you’ve indicated. Here’s what that looks like:
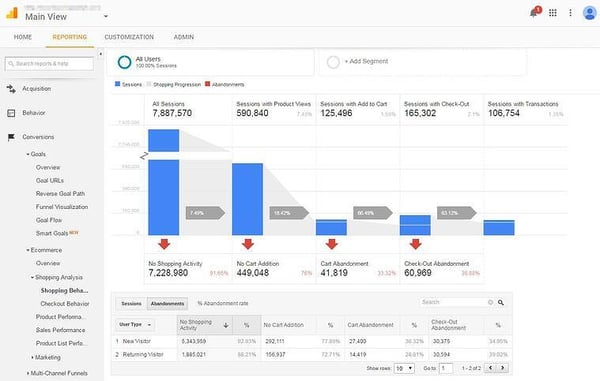
This report shows you how many customers drop off during each stage of the customer journey. Here, you can see the total number of baskets abandoned and how many customers abandon on the cart page vs. the checkout process.
These are important metrics to measure as they allow your business to track and monitor checkout trends. If you find that the number of visitors leaving during the checkout process starts to rise, it may be time to revisit the checkout process for issues while optimizing it for conversions.